Who has been the best player among the four? - A statistical comparison

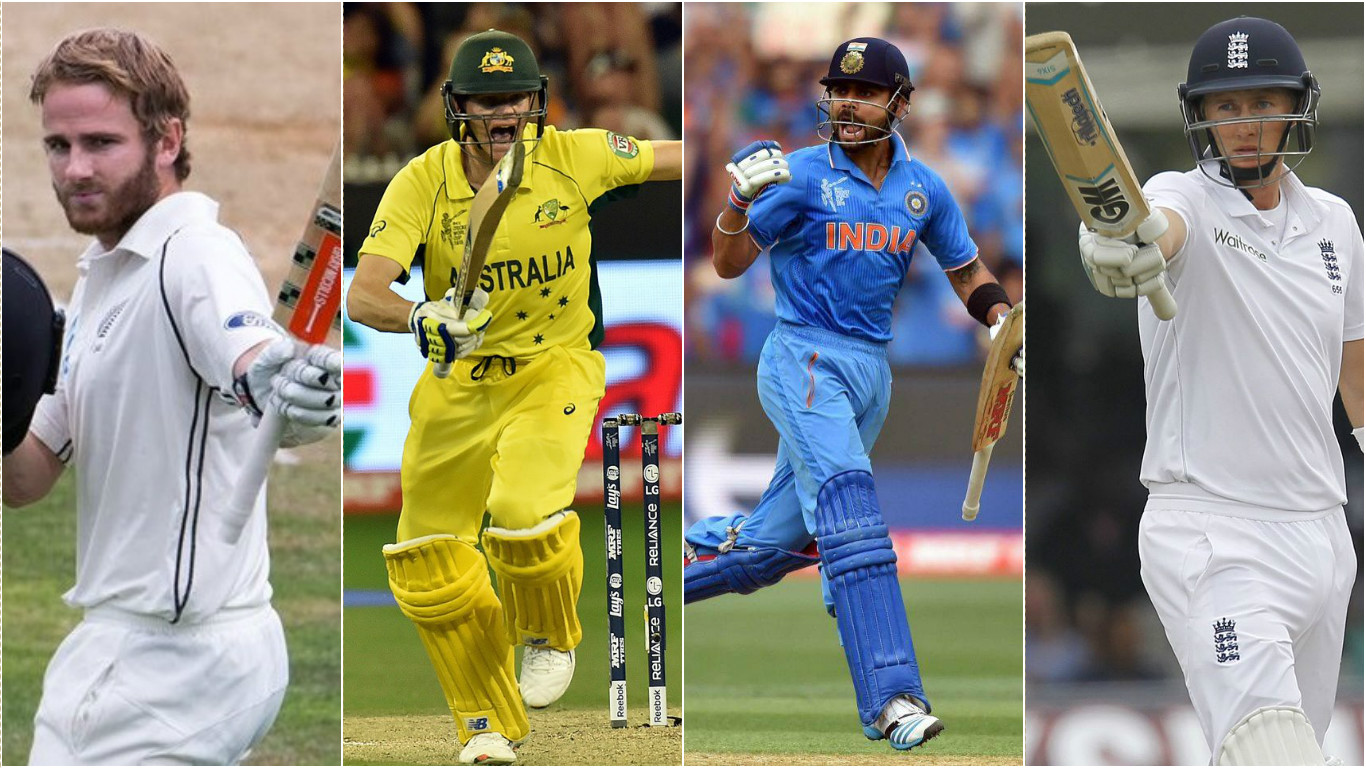
Virat Kohli, Kane Williamson, Joe Root and Steven Smith - they all made their Test debuts almost around the same time, between 2010-12. In fact, three of them have played exactly 72 innings to date. All four were tipped to be captaincy material the moment they took to the field - two of them are already captains of their Test sides and the other two are near-certainties for the role sooner or later. All of them are at the peak of their powers, and all in their mid-twenties, 25 to 27 years. All except one have at least one double century to their name. This is just one more incremental effort in the effort to compare and comprehend the collective greatness of the 'Fantastic Four'.
Comparison across formats
The performances of the four follow an almost perfect inverse relation between the Tests and the limited overs formats.

Steven Smith has an astronomical average in Tests, but his ODI and T20 numbers do not show him in good light, thanks to his abysmal ODI averages of 20.4, 14.5 and 8.0 in 2011,12 and 13. His current ODI average, therefore, is a testament to how transformed a player he has been. And his ability to hit big Test centuries has not been matched by the other four – he finally managed to break the 200 jinx with a 215 against England the Lord's in July last year after falling in the 190s twice before.
Virat Kohli, on the other hand, is head and shoulders above the competition when it comes to limited overs – he is the only one of the four to hold a 50+ average in both. Kohli's work rate is nothing short of phenomenal - he hits a century in every 6.5 ODI innings he plays as opposed to 12, 10 and 11 for Williamson, Root and Smith respectively. He scores a Test century as well in every 6.5 innings which is the same as Williamson, and higher than Root, although he is the one to not hold a double century in the quartet.
(Also Read: Bully at home; ‘Billy’ away – Is India’s Test record really that bad?)
However, he has probably been let down by the team when it comes to converting them into big centuries. Only two of his Test 100s have come in winning causes, while 5 of the other 9 have been in matches where India have lost. His average appears in better light when you look at the fact that India plays its home matches on dustbowls.

Williamson has had a phenomenal two years - in 2014, his averages read 61.9 and 70 in Tests and ODIs, while 2015 saw him average a whopping 90.2 and 57.33. The Kane juggernaut shows no signs of stopping anytime soon.
Joe Root has been a slump by his standards in 2015 – in Tests, he scored at an average of 97.1 in 2014 while in 2015, it was down to 60.2. How the mighty have fallen! If not for that bad 2013, he could very well have been on top of the Test charts.

Test comparison
While it is unsurprising that the batsmen have better averages at home than away, the breadth of the band between home and away speaks volumes. While Kohli's numbers look the least on the charts, look at this fact – only three of his 11 centuries have come at home, while Joe Root has had the luxury of scoring seven of nine centuries at home and Smith has eight of his 13 centuries at Australia.

Additionally, Root and Smith's runs have mostly come in the first innings – the gulf in their averages across innings is not even funny. On the other hand, Williamson seems to revel under pressure. In the 2nd Test against Sri Lanka in January 2015, after the Kiwis fell behind by 135 runs despite Williamson's top-scoring fifty in the first innings, he scored his lone double century in the second innings to take the side to 524. Sri Lanka would face the brunt of his second-innings again in December again – in a low-scoring Test, New Zealand were 2/11 in a chase of 189 before Williamson took the team home with a century knock.

Kohli's fightbacks are even more spectacular, although he has been, time and again, let down by the team. Those back-to-back centuries in the Adelaide Test in India's 2015 tour are testament enough – he was the last man standing at 141 as eight wickets tumbled in the last 73 runs and India fell short by 48 runs eventually.
ODI comparison

Away matches include matches held in neutral venues
Smith's record again seems suspect when it comes to ODI averages – his home average is more than double his away number. While Kohli, as expected has been happy in the hunting grounds of sub-continental pitches, his away average still holds close to 50. On the other hand, Williamson and Root have found themselves better in away tracks than at home. Williamson has been the most prolific in away pitches, although he has surprisingly struggled in the subcontinent. Joe Root, in fact, finds New Zealand, Sri Lanka, South Africa, West Indies, India and the UAE more to his liking than English pitches when it comes to ODIs.
(Also Read: The Abraham Benjamin Effect)

Once again, when it comes to pressure situations, Virat Kohli seems to be the man you would bet your life on. Kohli hits 61 runs on average when India is chasing – that record should not even be legal. The other three, predictably, find it better to play without the pressures of chasing as do mere mortals.
Conclusion:
Virat Kohli, without doubt, is the best limited-overs batsman with his ODI and T20 records hovering on the horizon. He also is the best batsman under pressure across formats. Only his away Test record seems to let the man down.
Williamson has been the fastest rising among the four, and if he is able to continue his incredible form for a year – all this number-crunching may as well take a break.
Steven Smith appears the best Test batsman at present, but he may yet lose the crown to Williamson despite his phenomenal 2014 and 2015 unless he finds a sixth gear.
Joe Root, meanwhile, seems to be caught in the shadows of these men and would earn his place only if he manages to replicate his home success elsewhere and his 2014 a few times more.
Credit: All data for the piece has been generated from the ever-benevolent espncricinfo.com. All data as of February 3.
(Also Read: Where is Indian cricket going? 2015 in stats)